Q1 2021 Research Theme: A Deep Dive on Carbon Capture, Usage and Storage
- Mar 31, 2021
- 20 min read
Updated: Nov 16, 2022
Innovation In Carbon Capture, Usage & Storage
Consistent with PillarFour’s investment focus – scalable, proprietary, sustainable technologies within the oilfield service (OFS) sector – we take a look at carbon capture,
utilisation and storage (CCUS): the scale of CO2 emissions, past & present, the regulatory environment, taxes and incentives, and the various innovative CCUS technologies being developed and deployed.
Net-Zero – Necessity Is The Mother Of Invention
As the economic and human toll of the Covid-19 pandemic recedes, so growth in global energy demand resumes once more, underpinned by rising levels of prosperity and rapid urbanisation in emerging economies albeit partially offset by continuing improvements in energy efficiency. Against this backdrop, hardly a week goes by without news items or commentary referring to the ‘Energy Transition’ as a growing list of nations and companies alike pledge to reach ‘net zero’ or ‘carbon neutrality’ by 2050. Countries worldwide have introduced a broad array of regulatory mandates, financial ‘carrots’ and ‘sticks’ to
speed the transition toward low-carbon or zero-carbon solutions for power, buildings, transport and industry. Decarbonization of energy and industry is a truly gargantuan task – fossil fuels currently provide about 84% of global primary energy and, with industrial processes, generate about 65% of all anthropogenic GHG emissions. However, a total substitution of fossil fuels by renewable energy sources is neither simple nor feasible – technically, physically or economically – across all applications. Indeed, all but the most radical routes to net-zero published to date acknowledge that despite vast and accelerated investment in renewable energy technologies and global capacity, led by solar PV and wind, fossil fuels will still be required to meet a significant albeit lower share of global energy and product demand. Disruptive carbon capture technologies are being developed along with innovative processes for storage and re-use of carbon dioxide. The long-held view that CCUS is too expensive to adopt at scale will become history as competition and innovation drive down technology costs and open up new markets for low-carbon products, while carbon price signals become increasingly compelling. Already the global leader in CCUS, the oil & gas sector, operators and OFS providers alike, has a clear financial, indeed existential incentive and the resources, breadth of skills and experience to play a leading role in funding, developing and deploying novel CCUS technologies at scale across in-house and end-user facilities – potentially heralding a new holistic business model for the sector.
Carbon Dioxide – The Primary Greenhouse Gas
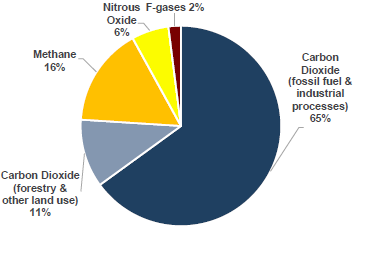
Global greenhouse gas (GHG) emissions are estimated at around 52 gigatonnes (Gt) CO2eq (i.e. all GHG emissions expressed in CO2-equivalent terms) per annum, of which carbon dioxide is by far the largest contributor, responsible for about three-quarters of all such emissions, more than four times that of methane.
Global GHG Emissions By Gas, %
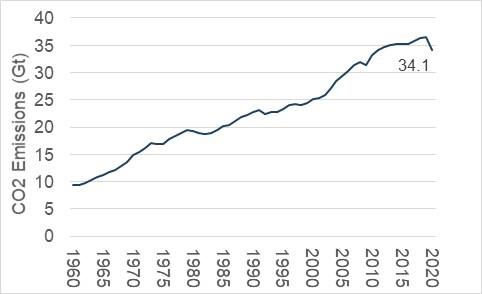
Estimated annual global CO2 emissions from fossil fuel combustion across all forms of energy usage – power, transport, heating and industrial processes – fell back to 34 Gt in 2020 due to the Covid-19 pandemic but are forecast to rebound in 2021, close to the record levels of over 36 Gt observed in 2018 – 2019. Fossil fuel and industrial CO2 emissions are up more than 50% since 1990 and up more than three-fold since 1960.
Global CO2 Emissions, 1960 – 2020
Add in about 5 – 6 Gt of estimated annual CO2 emissions from land use changes – a euphemism for deforestation for commercial livestock ranching, logging and agriculture – and we arrive at overall CO2 emissions of about 40 Gt per annum for 2020, or about 77% of total GHG emissions.
As with any ‘sources and uses’ cashflow statement, these gross CO2 emissions represent just one part of the story. A variety of natural sinks thrive by absorbing and trapping atmospheric CO2: the earth’s biosphere and oceans – trees, vegetation, soil, rivers, lakes and the like.
The Global Carbon Dioxide Cycle

These natural sinks trap substantial amounts of atmospheric CO2 but cannot keep up with the current levels of CO2 emissions – an imbalance that adds an estimated 19 Gt per annum to atmospheric CO2 levels, about 45 – 50% of gross CO2 emissions.
Atmospheric carbon dioxide persists for centuries, unlike methane which degrades via tropospheric oxidation.
Given the growth rate, scale and longevity of these excess annual additions, the mass of atmospheric carbon dioxide is now estimated to stand at some 3,200 Gt. Expressed in the terminology often quoted in the media, the atmospheric concentration of carbon dioxide now stands at ca. 412 ppm or 0.04%, almost 50% above pre-industrial levels.
Mass balance analysis and carbon isotope ‘fingerprinting’ indicate that fossil fuels are the prime culprits in driving net CO2 emissions and in turn atmospheric CO2, to levels not previously witnessed in human history.
The Energy Transition - Aspiration to Legislation
Translating complex climate science into language and actions that people and politicians alike can readily agree to and adopt has proved difficult and often controversial. Broad engagement was hindered by dry discourse about the concentration of CO2 in the air or the relative merits of limiting an average global temperature rise to 1.5oC or 2oC.
By 2018, the political focus shifted – the IPCC urged all governments to commit to achieving net-zero emissions by 2050 – limiting, by their analysis, global warming to 1.5oC.
Reframing this complex global issue in an unambiguous manner – requiring individual measurable actions against a timescale – mobilised support and accelerated change.
As of April 2021, the EU and 43 further countries have pledged to achieve a net-zero emissions target by 2050. Even China, the world’s largest polluter, is on board with a 2060 goal. In all, these countries account for some 70% of global CO2 emissions and GDP.
The majority of such pledges take the form of policy statements, statements of intent, submissions to the UN and suchlike. However, ten countries – including the U.K., Denmark, France, Sweden, Hungary and New Zealand – have moved beyond aspiration to legislation, with net-zero emissions targets now enshrined in law.
Global CO2 Emissions From Energy Use By Sector, %
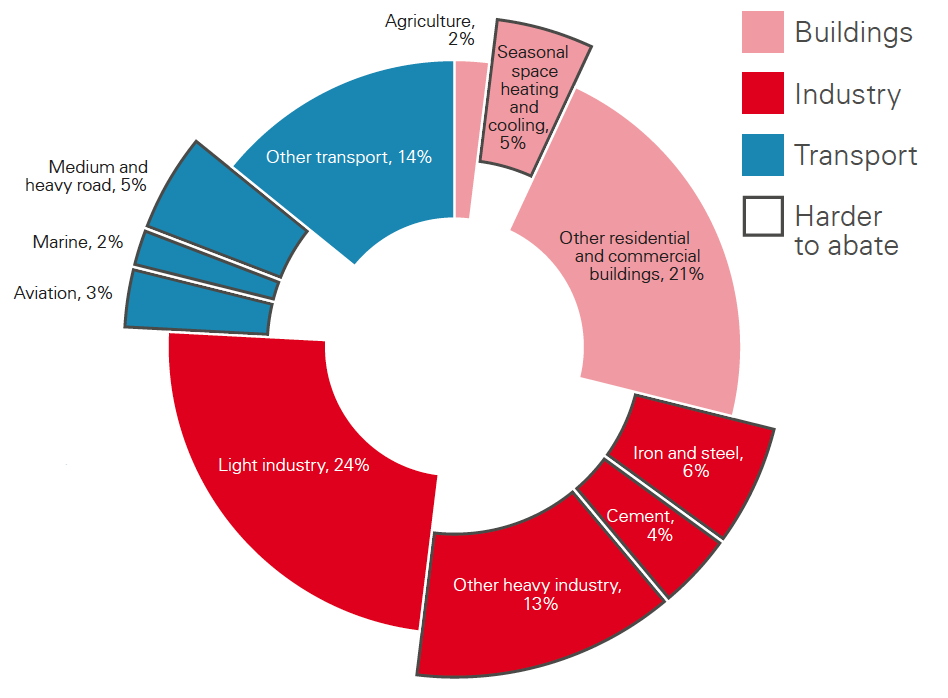
Almost half of the CO2 emissions from energy use stem from industrial applications, with the remainder split fairly evenly between buildings and transport.
Clean power will ultimately decarbonise activities that can be economically electrified e.g. electric cars, light industry.
However, there remain significant sub-sectors where carbon emissions will prove much harder to abate.
Industrial processes such as oil refining, iron & steel, chemicals and cement manufacture yield emissions whose elimination requires new chemistry, not just clean energy.
Likewise, heavy goods vehicles, marine transport and commercial aviation will all require innovative, practical low-carbon energy solutions that offer higher energy density than electric batteries charged via a green grid.
Delivering net-zero emissions by 2050 will require a broad palette of novel commercial-scale low-carbon solutions beyond green grid-based electricity such as hydrogen, biofuels and carbon capture, usage and storage.
CCUS projects are capital-intensive and typically bespoke – each installation a ‘one-off’ tailored by virtue of scale, CO2 source concentration and potential offtake options.
Regulatory diktats alone will not be enough to drive the scale of investment in additional global CCUS capacity required to contribute toward net-zero emissions by 2050.
Policy Frameworks – Regulations & Tax Policies
As the Covid pandemic has demonstrated, balancing the obvious public good of coordinated global action with domestic economic self-interest has proved challenging.
So too with carbon pricing. Despite broad consensus as to its supportive role in the energy transition – a global public good – a global price and program remain beyond reach.
Whether pledged or legally-enforced, governments worldwide apply diverse ‘carrots’ and ‘sticks’: tax credits, subsidies, regulatory requirements and taxes to speed the energy transition toward low-carbon or zero-carbon solutions for power, buildings, transport and industry.
Tax Credits
Within the U.S., tax credits at both the federal and state level are the preferred incentive structure to spur investment in and deployment of low-carbon and renewable energy technologies.
Federal 45Q Tax Credits – Up To US$50 Per Tonne …
Enacted in 2008 but reformed in 2018 to broaden project eligibility, flexibility and value, the U.S. federal 45Q tax credit is available for every tonne of qualified carbon dioxide (or monoxide) permanently sequestered (CCS) or put to use (CCU).
All eligible CCUS projects, once operational, will receive a 45Q tax credit worth up to US$50 per tonne for geologic CO2 sequestration or up to $35 per tonne for CO2 used for enhanced oil recovery or other approved low-carbon processes and products that reduce lifecycle emissions – for the first 12 years of operational service.
45Q Tax Credit – Broader Eligibility, Increased Value

… And Transferable To Investors Via ‘Tax Equity’
Initially awarded to the owner/operator of a CCUS facility, the value of these 45Q tax credits obviously hinges on whether the owner/operator has sufficient taxable income.
However, as with wind and solar PV projects which also benefit from federal tax credits, these 45Q tax credits are transferable to investors via certain ‘tax equity’ structures.
Such ‘partnership flip structures’ allow owner/operators to secure financing for CCUS projects by partnering with ‘tax equity’ investors who can better and more fully utilize the prospective 45Q tax credits once the project is operational.
Proposal To Extend 45Q Program And Raise Credits
The current federal 45Q tax credit program closes to fresh applicants in 2025. However, a recent U.S. House of Representatives bill would, if approved, make the 45Q program permanent and also raise the tax credit payments to US$85 per tonne CO2 for CCS projects (from US$50) and US$50 per tonne CO2 for CCU projects (from US$35).
State-Level Incentives Can Add US$200+ Per Tonne
Furthermore, the 45Q federal tax credit can be combined with state-level clean energy incentive programs. For example, Texas provides a broad range of tax incentives for EOR projects; California provides a Low Carbon Fuel Standard (LCFS) tax credit for CCS projects that supply low-carbon transportation fuels to the state. Capped at US$200 (2016 real), this LCFS credit currently averages US$185 per tonne of CO2 – a substantial incentive that, for example, enables low-carbon ethanol producers with CCS to effectively obtain premium pricing for what otherwise would be a low-margin commodity product.
Carbon Taxes
Finland introduced the world’s first carbon tax in 1990. Since then over twenty nations have also implemented carbon taxes, albeit widely divergent in terms of their pricing and applicability to different sectors of their economies.
Carbon Taxes By Country, As Of Nov 2020

At US$133 per tonne CO2, Sweden currently levies the highest carbon tax globally, while Poland’s US$0.07 per tonne CO2 is so low as to be more or less irrelevant.
Canada’s federal carbon tax sets a minimum backstop for carbon pricing across its provinces. Currently set at C$40 (US$33.3) per tonne CO2, post a recent Supreme Court ruling this federal backstop is now set to increase four-fold to C$170 (US$142) per tonne CO2 by 2030.
The U.K. introduced a Carbon Price Floor in 2013 (similar in manner to Canada’s federal ‘backstop’ carbon tax) at £16 (US$22.6) per tonne CO2. Set to increase to £30 (US$42.4), the U.K. government decided in 2018 to cap this carbon tax at £18.08 (US$25.5) per tonne CO2.
‘Cap & Trade’ Emissions Trading Systems
Set up in 2005, the EU Emissions Trading System (ETS) was the world’s first carbon trading market and remains the largest and only regional market, accounting for over 75% of global carbon trading.
Similar national or sub-national ETS systems now operate in Australia, Canada, China, Japan, Kazakhstan, Mexico, New Zealand, South Korea, Switzerland and the U.S.
Having exited the EU, the U.K. has also launched its own national ETS, largely modelled on that of the EU.
The EU ETS covers over 11,000 energy-intensive facilities that account for about 40% of Europe’s GHG emissions.
The EU ETS is a ‘cap and trade’ system: the cap determining the overall GHG emissions permitted. All designated installations must submit sufficient emissions allowances to cover their verified annual GHG emissions or face a large fine and the carryover of any shortfall.
The emissions cap is reduced year-on-year, in turn cutting the number of ETS allowances available to the market – essentially the preschool game of ‘musical chairs’.
Under this shrinking cap, companies receive or buy emission allowances which they can trade as required.
The growing scarcity of such freely traded allowances should, in theory, deliver lower GHG emissions at the lowest overall cost to market participants and the EU economy as a whole.
In practice, free ETS handouts to heavy industry and unambitious GHG targets undermined EU ETS pricing and thus EU investment in low-carbon solutions until recently.
EU ETS Carbon Contract - Price & Volume, 2018 to date

However, the EU decision last December to drive 2030 GHG emissions down to 45% of 1990 levels, from a prior 60% of 1990 target, has seen the recent value of EU ETS allowances double to a record Eu55 (US$67) per tonne CO2, accompanied by an explosion in trading volume.
EU plans to rein in free ETS handouts have been thwarted by heavy industry lobbying amid growing speculation that financial investors are driving the recent surge in pricing.
Carbon ‘Leakage’ Handicaps Domestic Heavy Industry
One of the biggest issues for carbon pricing – whether a fixed tax or ‘cap and trade’ scheme – is carbon ‘leakage’.
If any country or region imposes a carbon price, supply chains will naturally migrate toward other countries with lower carbon costs, disadvantaging domestic heavy industrial low-margin commodity producers in particular.
Historically the EU dealt with ‘carbon leakage’ by handing out free ETS allowances to such businesses, essentially defeating the whole purpose of establishing a carbon price.
The EU now plans to impose a carbon border tax. By charging each company that exports carbon-intensive goods to Europe an individual levy to achieve overall carbon tax parity with the EU ETS price, the EU seeks to ‘level the playing field’ while also providing an incentive for such exporters to curtail their own CO2 emissions.
Like so many EU directives, such a move would be extremely complex and costly to administer. In addition, such a levy may even prove illegal under WTO rules!
----------------------------------------------------------------------------
Thirty years since the first carbon tax, the regulatory backdrop for carbon pricing still remains complex and geographically fragmented, the result being substantial variance in price signals not only on an international scale but even domestically within countries such as the U.S. Emissions trading systems, due to the shrinking cap, can provide certainty about overall environmental outcomes, but little certainty as to price signals.
By contrast, carbon taxes or tax credits provide certainty as to pricing, ensuring that companies can better budget, plan and make long-term investment decisions, but little certainty as to the overall environmental outcome.
The range and value of carbon tax credits available in particular U.S. states is clearly working: the U.S. dominates the global CCS project pipeline and North America plays a leading role in innovative CCUS R&D. The long-held view that CCUS is just too expensive to adopt at scale is fast becoming history as competition and innovation drive down technology costs and thus open up new markets for low-carbon products, while carbon price signals become increasingly compelling.
Current CCS Capacity – 26 Plants, 40 Mt Per Annum …
There are just 26 commercial-scale CCS (carbon capture & storage) facilities in operation worldwide which together capture about 40 Mt of CO2 per annum – a miniscule fraction (just 0.12%) of the 34 Gt of annual CO2 emissions from fossil fuels and industrial processes.
The commercial CCS project pipeline continues to grow with 17 further CCS facilities announced in 2020. The U.S. accounts for 12 of these 17 planned facilities, a testament to the financial support provided by the federal 45Q and California’s Low-Carbon Fuel Standard tax credits.
… 100 – 200-Fold Global Capacity Expansion By 2050
However, the scale of additional CCUS capacity and investment required to contribute toward net-zero GHG emissions by 2050 is staggering:
The IEA and BP’s respective Net Zero scenarios call for global CCUS capacity of 7.6Gt and 5Gt respectively of CO2 per annum by 2050 – over 100-fold current capacity!
The allied investment to deliver such global CCUS capacity is estimated at US$100 – 160bn per annum.
The race is now on to develop and deploy a range of low-cost, scalable CCUS technologies that are economically viable under the current carbon tax mechanisms available.
CO2 Capture, Usage (CCU) & Sequestration (CCS)

The chart above lays out the principal methods of carbon capture, utilisation (CCU) and sequestration (CCS).
There are two distinct methods of carbon capture, differentiated by the source of the carbon dioxide.
‘Point Source’ Capture
The principal and incumbent approach to carbon capture seeks to stem the flow of CO2 into the atmosphere from the ‘point source’ flue gases of power plants and energy-intensive manufacturing processes such as iron & steel, cement, chemicals, hydrogen and ethanol production.
However, such ‘point sources’ of CO2 vary widely in terms of flue gas CO2 concentration: from >90% for ethanol and ammonia plants, 20-30% for cement plants and 3-4% for gas-fired power plants. Such variance impacts the choice of capture technology and associated energy costs.
Liquid Solvents
Within the oil & gas industry, gas separation facilities have long relied on liquid amine chemical solvents to ‘scrub’ (i.e. absorb and remove) CO2 from produced gas streams.
To date virtually all large-scale carbon capture facilities have relied on the same liquid amine technique to capture CO2 from flue and other effluent gas streams.
However, liquid amine systems require a lot of heat to release the captured CO2, fresh solvent due to degradation, and cause corrosion of plant equipment.
Innovation is therefore focused on novel solvents, substrates and processes that allow efficient CO2-amine reactions at both lower CO2 concentrations and lower cost.
Advanced liquid solvents that dissolve rather than react with CO2 have been developed to address the issues with liquid amine solvents: energy, degradation and corrosion.
For example, CarbonClean has developed a proprietary liquid solvent/absorption process that operates withCO2 gas concentrations of 3 - 25% and produces CO2 at a purity of up to 99% using 40% less energy than a traditional amine-based system, with less waste and corrosion.
Solid Adsorbents – MOFs Stand Out As A Disruptor
Of the various physical and chemical solid adsorbents currently used to trap CO2, metal organic frameworks (MOFs) stand out as a potentially disruptive technology.
MOFs are porous solid materials that behave like finely-tuned chemical sponges, able to absorb vast quantities of a specific gas molecule, such as CO2, due to their massive internal surface area. A MOF the size of a sugar cube possesses a reactive capture area as large as a football pitch! No wonder that MOFs can capture five times the CO2 that an equivalent modern liquid amine system can.
With such finely-tuned adsorption properties, MOFs require minimal energy – just a small shift in temperature or pressure – to release CO2 – thus saving a great deal of energy. Furthermore, MOFs offer equal capture efficiency regardless of CO2 concentration, from natural gas to air.
Svante develops ‘point source’ carbon capture systems using scalable rotary solid adsorbent-based modules. The company recently partnered with Mosaic Materials, a leading designer of MOF-based CO2 adsorbent materials, to develop and scale up manufacture of proprietary MOFs for inclusion within their rotary carbon capture system – the goal being improved carbon capture at lower cost.
Rapid Rotary CO2 Capture Using MOF Adsorbent

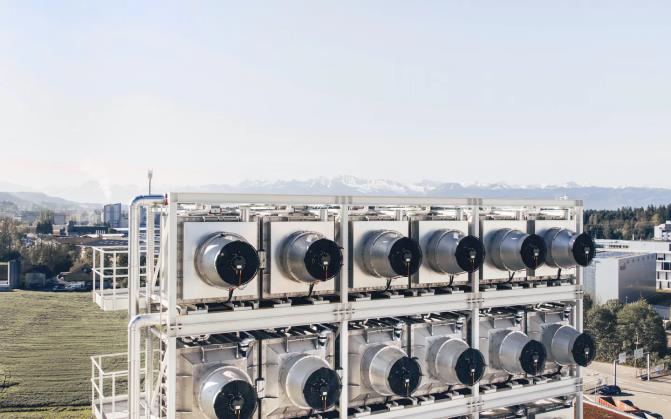
Direct Air Capture
An emerging approach to carbon capture is that of direct air capture (DAC) – a process that removes atmospheric CO2 directly from ambient air. Unlike ‘point source’ CO2 capture, DAC addresses the stock of CO2 already present within the atmosphere. As such, DAC complements rather than competes with ‘point-source’ capture.
DAC can offset CO2 emissions from dispersed sources where ‘point source’ capture would be impractical, ineffective or uneconomic – an obvious example being commercial aviation, either fossil-fuel or biofuel powered.
Furthermore, DAC facilities can be co-located with renewable energy sources, geological storage or manufacturing facilities that sequester or use the captured CO2 respectively – essentially anywhere that offers economic advantage to the CCUS value chain.
Air is drawn through the DAC module in which a solid or liquid sorbent chemically binds with and captures the CO2. A period of heat or reduced pressure releases a purified stream of CO2 from the sorbent, effectively cleansing or ‘recharging’ the sorbent for the next capture cycle.
At just 0.04%, atmospheric CO2 concentration is extremely low compared with ‘point source’ flue gases. DAC currently requires a lot more energy to isolate and purify the CO2.
Unit capture costs ultimately depend on the energy required to draw air through the DAC module and release the CO2 as well as the trade-off between capture/release cycle time and sorbent volume, capacity and selectivity.
Schematic Diagram Of Direct Air Capture
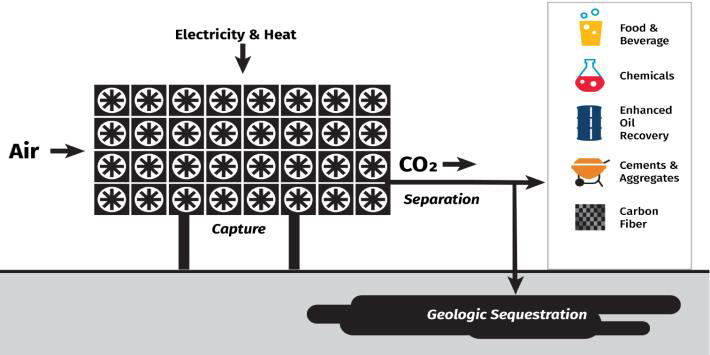
Once extracted and purified, the CO2 can be sequestered permanently in deep reservoirs, or used to manufacture low or zero-carbon concrete, polymers and synthetic fuels.
The principal companies developing direct air capture technologies and systems are Carbon Engineering, Climeworks and Global Thermostat.
Liquid-Based Direct Air Capture
Carbon Engineering uses an aqueous hydroxide that reacts with CO2. The resulting carbonate salts are filtered, extracted and reheated (calcined) to >700oC to release pure CO2 – the latter process requiring a lot of heat energy.
Pairing this DAC process with geological CO2 storage will deliver ‘negative-carbon’ emissions net of energy consumption provided that renewable energy is used to meet all heat and energy requirements.
Solid Adsorbent-Based Direct Air Capture
In contrast to Carbon Engineering’s approach, Climeworks and Global Thermostat both rely on proprietary solid adsorbent materials to adsorb CO2 from the air. Once saturated with CO2, the solid adsorbent, in contrast to the calcination process required above, only requires modest heating to about 90oC to release purified CO2 before resuming the adsorb/release cycle once more.
Climeworks has several small-scale commercial facilities in operation worldwide; Global Thermostat operates a pilot plant with an annual capacity of 4000 tonnes of CO2 and has now partnered with ExxonMobil to scale it up.
Once more, provided all required power is met by renewable sources, the resulting ‘negative carbon’ emissions can be used to offset ‘hard to abate’ emissions.
The World’s First Commercial DAC Plant

Costs of Carbon Capture
The cost of carbon capture varies considerably with both the nature of source of CO2 and the relative maturity of the carbon capture technology under consideration.
The levelized (i.e. average lifecycle) cost of CO2 capture for industrial processes that generate highly concentrated levels of carbon dioxide output – such as ethanol, ammonia and natural gas processing – can be as low as US$15 – 35 per metric tonne of CO2.
Other industries, such as power generation, cement and iron & steel manufacturing, generate lower levels of CO2 within their effluent gas – the result being a higher CO2 capture cost of US$40 – 180 per metric ton.
Given the dilute nature of atmospheric CO2 and the relative immaturity of the technology, DAC is currently the most expensive approach, with estimates ranging from some US$130 – 475 per metric tonne of captured CO2. However, DAC technology remains at an early stage of development. Further technical innovation, particularly the potentially disruptive influence of innovative sorbent materials such as metal organic frameworks, coupled with scale economics in terms of both unit sizes and customer base will no doubt drive down costs over time.
Cost Of CO2 Capture By Source & Concentration

Carbon Utilisation – Innovation Opening New Markets
Carbon dioxide is best known for its major role in growing GHG emissions and thus manmade climate change. What is often overlooked is that CO2 is a useful feedstock for many industrial processes such as chemicals, concrete and plastics – an increasingly important and relevant role, given the pressure to reduce GHG emissions.
There is therefore much innovation in the field of carbon utilisation, as disruptive technologies seek to ‘embed’ captured CO2 in existing and new products – thus lowering lifecycle CO2 emissions while opening new CO2 markets.
EOR: Before discussing some innovative industrial uses for CO2, it is worth noting that EOR is the most mature form of CO2 utilisation: CO2 is injected under pressure into depleted oil & gas reservoirs to sustain production, raise reserves and increase ultimate hydrocarbon recovery.
Operators that employ CO2within their EOR projects will typically pay a tolling fee given the incremental value that EOR delivers to their bottom-line. Also, as mentioned earlier, the U.S. provides a federal tax credit for EOR usage of CO2, currently worth up to US$35 per tonne CO2
EOR remains the largest global market for captured CO2, however CO2 capture facilities must typically be close to a CO2 gathering pipeline or the EOR facility to be economic.
However, as CO2 capture costs decline via scale economics or disruptive technologies, the EOR market for CO2 can expand as improved supply-chain economics permit greater dislocation of sources, sinks and pipelines.
Note: EOR is often lumped together with CCS (carbon capture & storage) projects. Strictly speaking, however, CO2 within an EOR project is used (CCU) not stored. The CO2 remains mobile – injected into the reservoir, 5 - 10% gets entrained with production, separated and reinjected.
EOR-based CCU can perhaps be viewed as a ‘gateway drug’, paving the way for CCS where CO2 is sequestered within those same oil & gas reservoirs once finally shut-in.
Mineralisation: Natural carbon sinks are not limited to trees, vegetation and oceans. Vast quantities of carbon are naturally stored deep below the earth’s surface in rocks – think limestone. This mineralisation process, carbonation, centres on an exothermic reaction of CO2 with magnesium, calcium and iron minerals to form carbonates.
Concrete & Aggregate Products: The production of cement, a key ingredient in concrete, generates ca. 8% of global CO2 emissions – fairly evenly split between energy and process-related emissions. Concrete ultimately absorbs about 30% of those cement-based CO2 emissions via carbonation, but that takes decades to occur.
CO2 emissions have a ‘time-value’ due to their cumulative impact on atmospheric CO2 and thus climate change: reduced CO2 emissions today are more valuable than a similar reduction in CO2 emissions next decade.
Innovation is delivering such value, accelerating carbonation and thus reducing near-term CO2 emissions. Innovation is also playing a part in reducing concrete’s residual CO2 emissions.
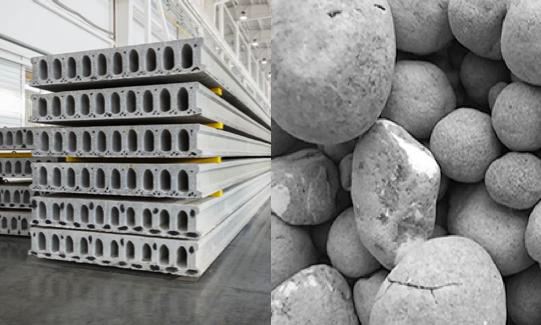
Numerous companies are developing and deploying novel concrete mix recipes and processing routes that substitute other materials for the CO2-intensive cement and/or capture and fix CO2 via carbonation at the initial mix/manufacturing stage – resulting in low-carbon, even negative-carbon, concrete and other aggregate products.
Such companies include CarbonCure, CarbonBuilt, CarbiCrete, Blue Planet, Solidia, Fortera, Brimstone Energy and Celluforce.
CO2 Sequestered In Concrete & Aggregate Products
Sequestration Via Accelerated Sub-Surface Carbonation: One obvious advantage of carbonation over gaseous CO2 sequestration is that the resulting carbonate rock is extremely stable, re-release of CO2 will not occur. However, natural carbonation is extremely slow
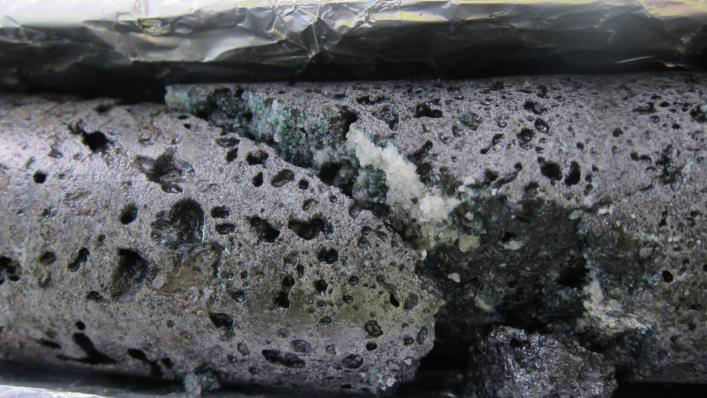
An accelerated subsurface carbonation process has been developed by Carbfix, using geothermal water to convey CO2 into reactive basalt rock – abundant, fractured and porous with ample magnesium, calcium and iron content – where the CO2 reacts exothermically to form carbonates.
Although just at pilot-scale capacity, the injected CO2 has been demonstrated to have become rock within two years.
Precipitated Carbonates Within Cored Basalt Rock
Chemical: Captured CO2, once purified, can be reacted with hydrogen to produce hydrocarbons which can directly, or via refining, be converted into synthetic fuel products entirely compatible with conventional fossil-fuel products.
Of course, such synthetic fuels do not permanently remove the captured CO2 from the atmosphere so much as recycle it. The CO2 only remains ‘captured’ until combustion whereupon it is once more released into the atmosphere.
However, if renewable energy is used to capture CO2 from the air (DAC), generate the hydrogen via electrolysis and power the reaction between CO2 and hydrogen, the resulting synthetic fuels will be carbon-neutral.
Biological: Like other plants, algae absorb CO2 during photosynthesis. However, algae have a prodigious appetite for CO2, more than any other biomass.
Captured CO2 can be used to accelerate the growth of algae which, in turn, can be used as a feedstock for foods, biofuels and plastics.
Carbon Storage – Global Capacity Not A Constraint
Geological storage – the permanent sequestration of CO2 in deep porous rock formations – is the final step in CCS.
To date, most operational CCS projects have focused on geological storage via EOR within existing oil & gas fields, overall CCS costs offset by the economic value of EOR.
The business case for CCS via EOR in the U.S. has been greatly boosted by the increased availability and value of 45Q federal tax credits and state-led tax incentives.
Notwithstanding such tax incentives, CO2 storage within a depleted oil or gas field has long made sense: the salient formation properties are known e.g. depth, porosity, permeability, pressure, storage volume and cap seal.
At over 300Gt, potential global geological CO2 storage capacity within major oil & gas fields is substantially larger than needed under any published net-zero CCS scenario.
CO2 storage within deep brine reservoirs offers an alternative to depleted oil & gas reservoirs where pipeline transportation of captured CO2 to an appropriate oil & gas field might prove prohibitively expensive. Such brine reservoirs are not only plentiful in number but vast in scale, at least ten-fold that of depleted oil & gas reservoirs
Download the PDF
This material is intended for information purposes only. This material is based on current public information that we consider reliable, but we do not represent it as accurate or complete, and it should not be relied upon as such. We seek to update our research as appropriate, but various regulations may prevent us from doing so.
Estimates, opinions and recommendations expressed herein constitute judgments as of the date of this research report and are subject to change without notice. PillarFour Capital Partners Inc. does not accept any obligation to update, modify or amend its research or to otherwise notify a recipient of this research in the event that any estimates, opinions and recommendations contained herein change or subsequently become inaccurate or if this research report is subsequently withdrawn.
No part of this material or any research report may be (i) copied, photocopied or duplicated in any form by any means or (ii) redistributed without the prior written consent of PillarFour Capital Partners Inc.
Website links or e-mail communications may contain viruses or other defects, and PillarFour Capital Partners Inc. does not accept liability for any such virus or defect, nor does PillarFour Capital Partners Inc. warrant that e-mail communications are virus or defect free.
This document has been approved under section 21(1) of the FMSA 2000 by PillarFour Securities LLP (“PillarFour”) for communication only to eligible counterparties and professional clients as those terms are defined by the rules of the Financial Conduct Authority. Its contents are not directed at UK retail clients. PillarFour does not provide investment services to retail clients. PillarFour publishes this document as a marketing communication and NOT Independent Research. It has not been prepared in accordance with the regulatory rules relating to independent research, nor is it subject to the prohibition on dealing ahead of the dissemination of investment research. It does not constitute a personal recommendation and does not constitute an offer or a solicitation to buy or sell any security. PillarFour consider this note to be an acceptable minor non-monetary benefit as defined by the FCA which may be received without charge.
This note has been approved by PillarFour Securities LLP (FRN 722816) which is authorised and regulated by the Financial Services Authority.


